Quality Assurance Program ~ Baldrige
Contract Number: N00178-10-D-5973

CredoGov's philosophy is that a strong quality ethic must be a core part of the fabric for a successful company and one that is embraced by every employee within the organization as well as partner teammates. As our implementation strategy, CredoGov is utilizing the Baldrige National Quality Program to provide a framework for Quality and Performance Excellence.
Created by Congress in 1987, the Baldrige National Quality Program exists to help organizations improve their performance and succeed in the competitive global marketplace. Baldrige is the first and only public-private partnership and Presidential award program dedicated to improving U.S. organizations.
Additionally, value added Lean Six Sigma philosophies/processes are interwoven as appropriate to provide an integrated solution tuned to our organization and customers.
Baldrige Criteria for Performance Excellence Framework
A Systems Perspective
Criteria for Baldrige Performance Excellence Framework
The requirements of the Criteria for Performance Excellence are embodied in seven categories, as follows:
- Leadership
- Strategic Planning
- Customer Focus
- Measurement, Analysis, and Knowledge Management
- Workforce Focus
- Operations Focus
- Results
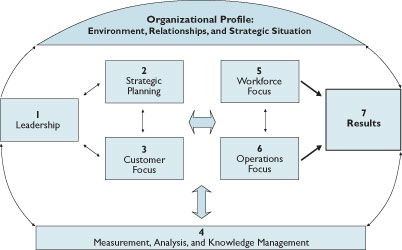
The figure above provides the framework connecting and integrating the categories.
From top to bottom, the framework has the following basic elements.
Organizational Profile
The Organizational Profile (top of figure) sets the context for the way the organization operates. The organization’s environment, key working relationships, and strategic situation— including competitive environment, strategic challenges and advantages, and performance improvement system—serve as an overarching guide for the organizational performance management system.
Performance System
The performance system is composed of the six Baldrige categories in the center of the figure that define your processes and the results you achieve.
Leadership (category 1), Strategic Planning (category 2), and Customer Focus (category 3) represent the leadership triad. These categories are placed together to emphasize the importance of a leadership focus on strategy and customers. Senior leaders set the organizational direction and seek future opportunities for the organization.
Workforce Focus (category 5), Operations Focus (category 6), and Results (category 7) represent the results triad. The organization’s workforce and key operational processes accomplish the work of the organization that yields the overall performance results.
All actions point toward Results—a composite of product and process outcomes, customer-focused outcomes, workforce-focused outcomes, leadership and governance outcomes, and financial and market outcomes.
The horizontal arrow in the center of the framework links the leadership triad to the results triad, a linkage critical to organizational success. Furthermore, the arrow indicates the central relationship between Leadership (category 1) and Results (category 7). The two-headed arrows indicate the importance of feedback in an effective performance management system.
System Foundation
Measurement, Analysis, and Knowledge Management (category 4) are critical to the effective management of the organization and to a fact-based, knowledge-driven system for improving performance and competitiveness. Measurement, analysis, and knowledge management serve as a foundation for the performance management system.
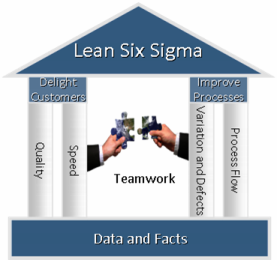
Lean Six Sigma
Lean Six Sigma is a business improvement methodology which combines (as the name implies) tools from both Lean Manufacturing and Six Sigma. Lean manufacturing focuses on speed and traditional Six Sigma focuses on quality. By combining the two, the result is better quality faster.
To successfully implement Lean Six Sigma, four key elements must be addressed:
- Delight the customer by delivering higher quality service in less time
- Improve processes by eliminating defects (anything that is unacceptable to the customer) and focuses on how work flows through the processes
- Use teamwork and share ideas with each so problems are solved
- Base all decisions on data and facts
Lean Six Sigma uses a modern problem-solving method called DMAIC which stands for Define-Measure-Analyze-Improve-Control. DMAIC has proven itself to be on the most effective problem-solving methods ever used because teams use data to…
- Confirm the nature and extent of the problem
- Identify true causes of problems
- Find solutions that evidence shows are linked to the causes
- Establish procedures for maintaining the solutions even after the project is done
DMAIC
The Define phase of the DMAIC process allows the team to agree on what the project is. Items that should be accomplished during the Define phase include:
Discussing the project charter as a team
- Getting customer data
- Reviewing existing data about the process or problem
- Drafting a high-level map of the process. “Process maps” are one type of improvement tools used often in DMAIC. In the Define phase they help establish project boundaries
- Setting up a plan and guidelines for the team
The tools most commonly used in the Define phase are:
- Project Charter
- Stakeholder analysis
- Suppliers, Inputs, Process, Output, and Customers (SIPOC) process map
- Voice of the Customer
- Affinity Diagram
- Kano Model
- Critical-To-Quality (CTQ) tree
DMAIC
Measure is the heart of what makes Lean Six Sigma work when other approaches haven’t. In the Measure phase teams will evaluate the existing measurement system, observe the process, gather data, and map the process in more depth.
The tools most commonly used in the Measure phase are:
- Prioritization Matrix
- Process Cycle Efficiency
- Time Value Analysis
- Pareto charts
- Control charts
- Run Charts
- Failure Modes and Effect Analysis (FMEA)
DMAIC
The purpose of the Analyze phase is to make sense of all the information and data collected in Measure, and to use that data to confirm the source of delays, waste, and poor quality. In the Analyze phase teams develop theories of root causes, confirm the theories with data, and finally identify the root cause(s) of the problem. The verified cause(s) will then form the basis for solutions in the Improve phase.
The tools most commonly used in the Analyze phase are:
- 5 Whys Analysis
- Brainstorming
- Cause and Effect Diagram
- Affinity Diagrams
- Control Charts
- Flow Diagram
- Pareto Charts
- Regression Analysis
- Scatter Plots
DMAIC
The sole purpose of Improve is to make changes in a process that eliminate defects, waste, cost, etc., which are linked to the customer need identified in the Define phase. In the Improve phase teams will identify a range of possible solutions, review existing Best Practices to see if any can be adapted to the situation, develop criteria for selecting solution, pilot the chosen solution, and plan for full-scale implementation.
The tools most commonly used in the Improve phase are:
- Brainstorming
- Flow Charting
- Failure Mode and Effects Analysis (FMEA)
- Stakeholder Analysis
- Setup Reduction
- Queuing Methods for Reducing Congestion and Delays
- 5S’s Method – Sort, Set in Order, Shine, Standardize, and Sustain
- Kaizen
DMAIC
The purpose of Control is to make sure that any gains a team makes last. That means creating procedures and work aids that help people do their jobs better. The team must transfer what they learned to the process owner and ensure that everyone working on the process is trained appropriately. During the Control phase teams will document the new improved process, train everyone, set up procedures for tracking key “vital signs,” hand-off ongoing management to the process owner, and complete project documentation.
The tools most commonly used in Control phase are:
- Control Charts
- Flow Diagrams
- Charts to compare before and after such as Pareto Charts
- Quality Control Process Chart
- Standardization
George, Mike, Rowlands, Dave, and Kastle, Bill. What is Lean Six Sigma? New York. 2004.